
Where Border Traffic Fell—and Road Trips Got Quieter
Border traffic has fallen sharply, improving choice on some routes, but matched hotel-rate data still does not prove towns are broadly cheaper.
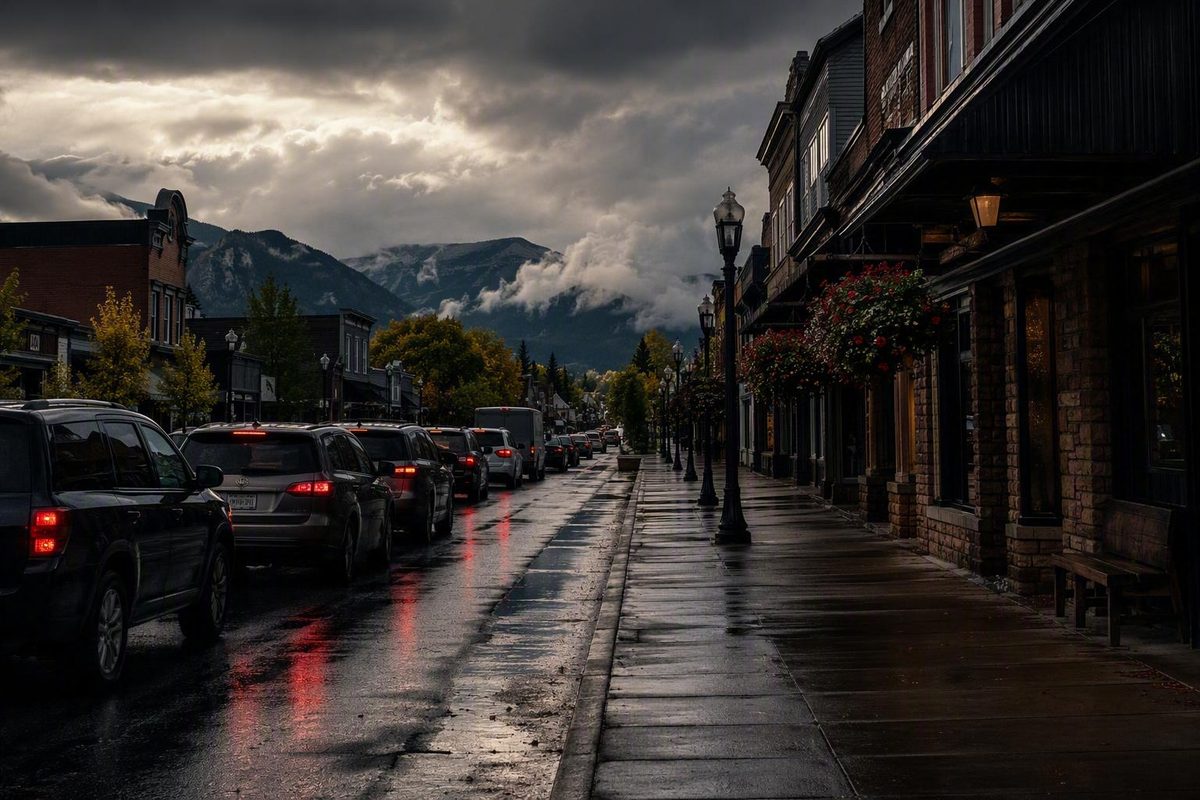
Canadian automobile return trips from the United States fell 38.1% year over year in May 2025, making parts of New England and the Great Lakes border corridor credible choices for a quieter road trip. But no matched dataset proves that border towns are broadly cheaper without Canadian tourists. The opportunity is better availability, lighter visitor traffic, and occasional targeted offers—not an automatic reduction in hotel, restaurant, fuel, or retail prices (Statistics Canada).
That distinction matters for planning. Empty overlooks and easier reservations can improve a trip even when posted prices remain unchanged. Travelers looking for value should treat the traffic decline as a reason to check New England and Great Lakes routes first, then compare live, all-in prices before booking.
Choose what matters most; the tool compares the reported demand signals and tells you which corridor fits.
Compare documented traffic declines, deal evidence and the risk of reduced services. A quieter corridor is not labeled cheaper unless matched price evidence exists.
New England: Northern Vermont
Default PickDerby Line crossings: about 69,000 in April 2024 versus 45,000 in April 2026. The percentage is rounded from the reported counts.
Traveler read: Strong evidence of lower cross-border traffic and the only current corridor here with reported at-par or proposed free-day incentives. Check reduced operating hours before relying on a stop.
Great Lakes: Western New York
Large MarketCanadian entries into New York fell 21% in 2025, representing more than 3 million fewer visits. Buffalo–Niagara personal-vehicle crossings fell 16.3%.
Traveler read: A strong quietness signal, but Niagara’s domestic leisure and event demand can replace missing Canadian visitors. Compare the exact dates.
Pacific Northwest: Blaine
Fuel CautionCar and pedestrian trips were about one-third lower in June 2025 than in June 2024.
Traveler read: Lower traffic is documented, but fuel policy moved the price comparison toward Canada. Do not infer cheaper gasoline from quieter stations.
| Corridor Evidence | Reported Change | What It Supports | Price Proof |
|---|---|---|---|
| Derby Line crossings | 69,000 Apr. 2024; 44,000 Apr. 2025; 45,000 Apr. 2026 | Persistently lighter border traffic | No matched rates |
| Vermont card spending | $6.43M+ Aug. 2024; $3.17M Aug. 2025 | Weaker recorded Canadian spending | No matched prices |
| Jay Peak | Pass renewals down 30%–35% | At-par Canadian offer reported | Targeted offer only |
| Kingdom Trails | Canadian members down 50% | Free bike day discussed | Proposed offer only |
| New York entries | Down 21%; 3M+ fewer visits | Large statewide demand decline | No matched rates |
| Buffalo–Niagara vehicles | Down 717,118, or 16.3% | Lower personal-vehicle traffic | No matched prices |
| Lewiston bakery | Revenue down 30% | Individual business stress | Revenue is not price |
| Lewiston antiques store | Sales down 20% | Individual business stress | Sales are not price |
| Blaine traffic | About one-third lower | Quieter crossing corridor | No matched rates |
| Blaine gas station | Fuel sales down about 60% | Individual business stress | No fuel-price decline shown |
| Blaine restaurant | Business down about 30% | Individual business stress | No menu comparison |
| Cross-border fuel policy | B.C. cost down ~17¢ CAD/L; Washington tax up 6¢ USD/gal. | Canadian fuel became more competitive | Check live prices |
“Lower” refers to the cited comparison period, not a forecast. Different crossing measures and dates are not directly interchangeable.
Sources: Statistics Canada; Business Insider review of Statistics Canada data; The Guardian; WCAX; PBS NewsHour; Northwest Public Broadcasting. Business losses are self-reported where identified.
The Business-Decline View Is Substantially Correct
Most coverage treats the Canadian travel decline as an economic-loss story, and the evidence supports that framing. Border businesses have lost customer traffic, revenue, bookings, and staffing hours. A Joint Economic Committee minority report described reduced hotel use, event attendance, sales, and customer traffic across border states, although its local accounts were testimonials rather than a comprehensive market survey (Joint Economic Committee minority report).
Canadian domestic travel rose 10.9% in the second quarter of 2025 as trips were redirected away from the United States. The U.S. Travel Association identified Canada as the main driver of an expected 3.2% decline in 2025 international inbound travel spending. Seasonally adjusted figures later showed Canadian residents returning from the United States still down about one-quarter year over year in November 2025 (Business Insider).
That hurts communities built around cross-border shopping days, restaurant visits, recreation and short hotel stays. Travelers should not confuse an opportunity to visit with evidence that the economic damage is trivial. Thin-margin businesses may respond to lost traffic by reducing hours, staffing or inventory rather than lowering prices.
The consensus becomes incomplete only when it treats economic weakness as a reason to avoid these routes. For a road trip, lower visitor volume can mean more room choice, less competition for restaurant tables and quieter stops. Spending at an operating local business also directs money into the places experiencing the decline. Neither point establishes that every purchase is discounted.
The Traffic Decline Is Large but Uneven
The May 2025 national figures show the sharpest documented break. Canadian-resident automobile returns from the United States were down 38.1% from a year earlier. Same-day automobile returns fell 40.3%, overnight returns declined 34.3%, and air returns from the United States were down 24.2%. Statistics Canada cautioned that it was not yet clear whether the shift would be temporary or lasting.
Those figures count Canadian residents as they return home. They do not identify how many were vacationers, where they stopped or what they paid. Crossings also include commuters, family visits, business trips, shopping trips and through traffic.
New York shows how the national decline reached a road-trip corridor. Canadian entries into the state reportedly fell 21% in 2025, amounting to more than 3 million fewer visits. Personal-vehicle crossings in the Buffalo–Niagara Falls area declined by 717,118, or 16.3%. Lewiston businesses reported corresponding losses in traffic, sales and staffing (The Guardian).
Vermont’s figures show a limited recovery from a depressed base rather than a return to earlier traffic. Approximately 139,000 crossings into Vermont were reported in April 2026, up from 126,000 in April 2025. That remained well below roughly 199,000 crossings reported for March 2024, although the different months prevent a precise like-for-like comparison.
At Derby Line, April crossings went from about 69,000 in 2024 to 44,000 in 2025 and 45,000 in 2026. Recorded Canadian credit-card spending across Vermont totaled $3.17 million in August 2025, compared with more than $6.43 million in August 2024. March 2026 spending was just over $1.9 million—about $70,000 below March 2025 and more than $1.8 million below March 2024. Card totals exclude cash and may not cover every payment network (WCAX).
These are strong demand indicators. They are not consumer price indexes for border communities.
Quieter Does Not Automatically Mean Cheaper
Revenue can fall because a business serves fewer customers while charging each remaining customer the same price. A hotel can have more vacant rooms without reducing its standard rate. A restaurant can lose tables while keeping its menu unchanged.
Lewiston illustrates the distinction. The owner of Just Desserts reported a 30% revenue decline, while a co-owner of Antique to Chic reported a 20% sales decline. Those self-reported losses establish stress at two businesses. The reporting did not compare pastry prices, retail prices, restaurant checks or hotel rates before and after the traffic decline.
Businesses facing high wages, food costs, utilities, insurance, taxes, maintenance and debt may have little room to discount. They can instead shorten hours, schedule fewer employees, reduce selection, postpone investment or close. For a traveler, the result can be the same price with thinner amenities.
Replacement demand can also preserve or raise prices. During the pandemic-era period in Kalispell, Montana, Canadians fell from about 10% of visitors to less than 1%. Out-of-state U.S. visits were nevertheless 14% above 2019 levels in 2020 and 5% above 2019 levels in 2021. Strong American demand reportedly pushed up hotel rates and other visitor costs. Lower fall and winter prices appeared when American visitation weakened, not merely because Canadians were absent (Federal Reserve Bank of Minneapolis).
Kalispell is not evidence of present-day rates. It demonstrates the pricing mechanism: total demand matters more than the nationality of the missing visitors.
New England Has the Clearest Quieter-Trip Case
Northern Vermont currently offers the strongest gap between gloomy business headlines and a useful road-trip opening. Derby Line’s April traffic remained roughly one-third below its 2024 level in 2026, while nearby businesses described weaker Canadian traffic and cash flow. That supports expecting less cross-border visitor pressure, especially at establishments that historically relied on Canadian day trips.
The region also has the clearest documented examples of businesses responding with incentives. Jay Peak offered Canadians at-par pricing. Kingdom Trails discussed a free mountain-bike day after its executive director reported a 50% decline in Canadian members. Jay Peak reported Canadian season-pass renewals down 30% to 35%, along with golf-group cancellations and weaker expected hockey-tournament business (PBS NewsHour).
Those offers demonstrate how genuine value may appear: a defined product, eligibility rule and booking period. They do not prove that all Jay Peak prices, nearby hotel rooms or Vermont travel costs declined. Previously reported offers may also have changed or expired.
For a New England itinerary, the practical advantage is optionality. A traveler can check northern Vermont rooms, recreation bookings and dining availability without assuming a regional markdown. Operating hours deserve equal attention because businesses coping with weaker demand may close earlier or open fewer days.
The Great Lakes Corridor Combines Lower Traffic With Strong Domestic Demand
Western New York’s 21% statewide entry decline and the 16.3% reduction in Buffalo–Niagara personal-vehicle crossings make the Niagara corridor another strong candidate for lighter cross-border traffic. The loss of more than 3 million Canadian entries statewide is large enough to affect businesses that depended on shopping and dining visits.
It does not establish a predictable hotel discount. Niagara Falls and Buffalo also attract U.S. leisure travelers, event traffic and through travelers. If that replacement demand fills rooms on a particular weekend, the Canadian decline may improve neither price nor availability.
The route is most promising when dates avoid major events and peak domestic travel periods. Live hotel inventory can reveal whether weaker Canadian demand has translated into a better room choice, a package or a flexible cancellation rate. The available sources do not provide matched room-rate data controlling for property, room type, weekday, season, taxes and booking lead time.
Historical Great Lakes figures reinforce the same limitation. Sault Ste. Marie recorded a 24% decline in lodging-tax revenue in 2020 compared with 2019. That demonstrated reduced taxable lodging activity, not the price of an equivalent room.
Blaine Shows Why Pacific Northwest Prices Need Separate Checks
Blaine, Washington, recorded car and pedestrian trips about one-third lower in June 2025 than in June 2024. One gas-station owner reported fuel sales down about 60%, while one restaurant reported an approximately 30% business decline. These were individual business accounts, and the reporting supplied no matched consumer-price comparison (Northwest Public Broadcasting).
Fuel provides a direct warning against turning lower traffic into a price assumption. British Columbia repealed its consumer carbon tax in April 2025, reducing fuel costs by about 17 Canadian cents per liter. Washington increased its gasoline tax by 6 U.S. cents per gallon on July 1, 2025. Those policy changes made Canadian fuel more competitive even as Blaine lost Canadian customers.
A useful fuel comparison must convert Canadian dollars per liter into U.S. dollars per gallon, then include exchange rates and the fuel consumed reaching the station. The corridor can still be quieter without being the cheaper place to fill the tank.
Lodging and Attractions Are the Best Places to Test for Value
If lower demand produces a deal, it is most plausible in perishable tourism inventory. A hotel cannot sell last night’s empty room, and an attraction cannot recover an unused date. That gives operators a reason to offer midweek rates, short-lived packages or targeted admissions.
The reviewed reporting documents vacancies, lower lodging-related revenue, reduced staffing and lost bookings. It does not provide a regional series comparing the final price of the same room before and after Canadian traffic fell. Greater vacancy may improve room selection without changing the posted rate.
Restaurants and stores have less freedom to cut regular prices when labor, ingredients and merchandise remain expensive. Their response may be a limited special, reduced schedule or narrower selection. No reviewed source supplies systematic before-and-after menu or shelf-price data.
Housing is farther removed from short-term visitor demand. The supplied evidence does not connect reduced Canadian tourism to lower rents, home prices or residents’ overall cost of living. Those claims would require separate local housing data.
A Bookable Price Is the Only Reliable Savings Test
Compare the same property, room type, occupancy, weekday, cancellation terms and included amenities. Use the final total after lodging taxes, resort fees, parking and other mandatory charges. A nonrefundable Tuesday rate is not evidence that an equivalent refundable Saturday stay became cheaper.
Check the property’s direct booking channel and one booking platform. For a flexible reservation, checking again before the cancellation deadline can reveal whether additional inventory or a late promotion appeared. A reported business downturn alone is not a reason to expect one.
For restaurants and attractions, confirm current hours along with prices. A quiet town can offer easier reservations while providing fewer evening choices. For targeted promotions, verify eligibility, travel dates, booking channels and currency treatment directly with the operator.
The defensible verdict is narrower than the headline economic story but still useful: New England and the Great Lakes are strong candidates for less-crowded border road trips because Canadian traffic has fallen substantially. They become cheaper trips only when a current, equivalent, all-in booking beats the alternative.